California Real Estate Market At A Glance – October 2021
TABLE OF CONTENTS (skip ahead)
# of Existing Home Sales
Median Price of Homes Sold
Unsold Inventory
Median Time on Market
Price Per Square foot
Sales to List Price Ratio
Here are the latest statistics for the California Real Estate market. This information can be helpful whether you are looking to buy or sell a home, or if you just want to keep a pulse on what’s happening in the California real estate market.
– # of Existing Home Sales
Knowing the number of existing home sales tells you the volume of sales that are happening in a given market. This can help you understand how significant the changes in other statistics are in comparison with the overall real estate market.
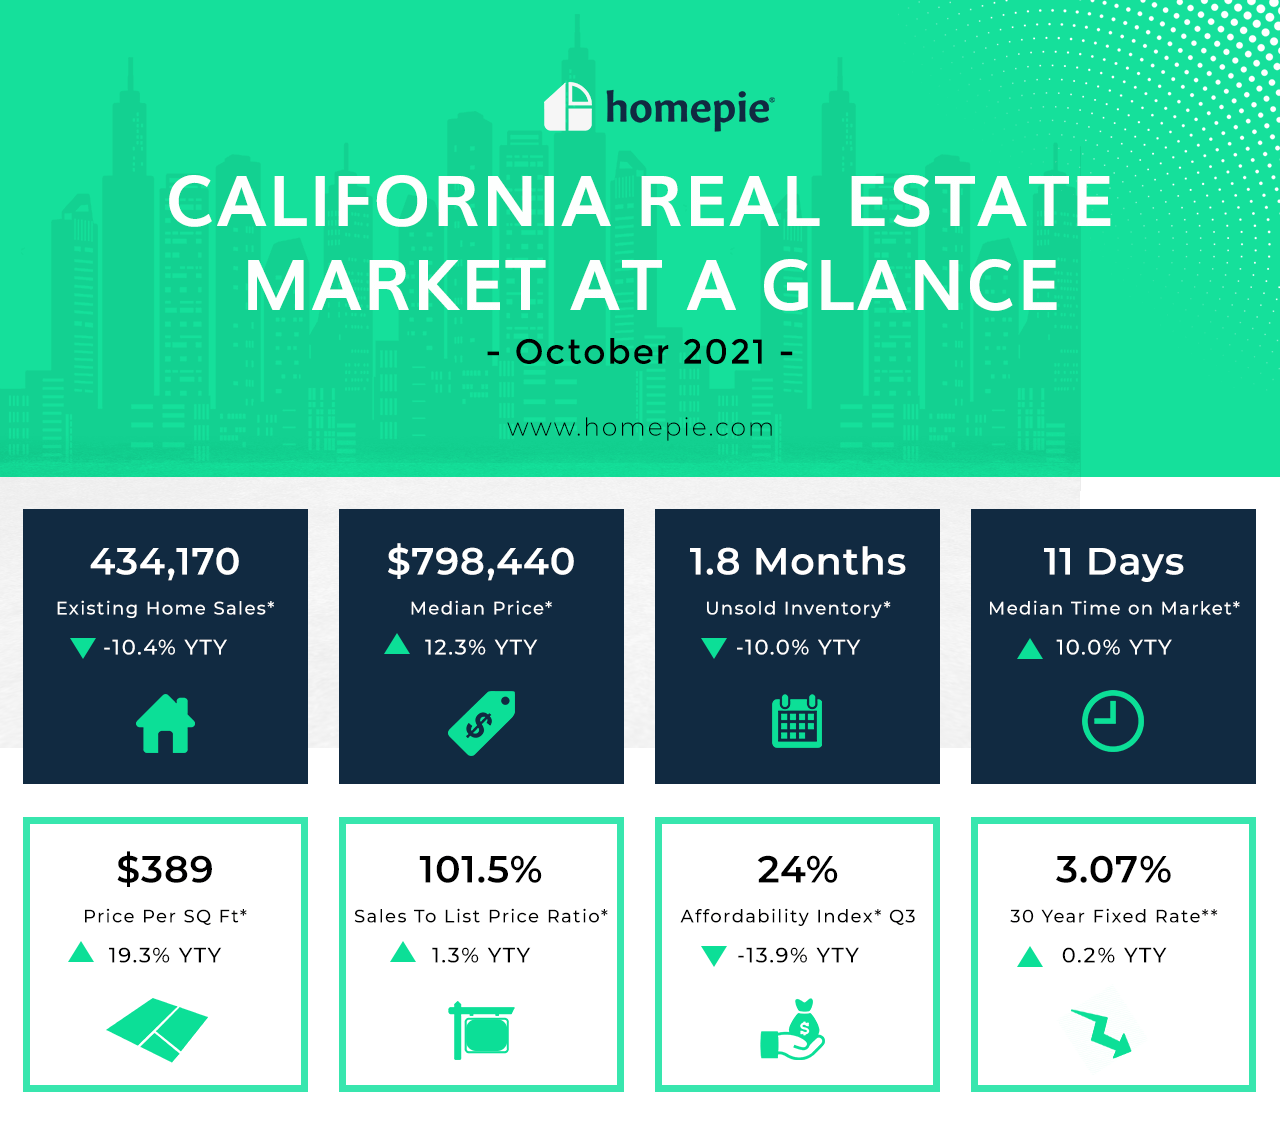
Compared to last year’s first full month of covid shutdowns, October 2020, existing home sales are down 10.4% year over year for October 2021. With a count of 434,170 homes sold in October.
– Median Price of Homes Sold
The median sales price is a key number to watch. It tells you what a typical home in California sells for. This is not the average sales price, as that number can be heavily skewed by just a few very large (or small) sales. Rather, this is a much more realistic interpretation of a market.
The median price has increased a whopping 12.3% year over year to $798,440.
– Unsold Inventory
Inventory is commonly formulated by dividing the number of homes currently for sale by the number of homes that sold the previous month. It tells us the current pace of home sales by calculating how many months it would take to sell off all the inventory available today, if no new homes hit the market. It has been said that a balanced market will have 4 to 6 months of inventory. Inventory below that indicates what’s known as a “seller’s market”, and inventory above that range indicates a “buyer’s market”.
The amount of unsold inventory in October of 2021 decreased year over year in California by 10.0% equating to only 1.8 months of inventory.
– Median Time on Market
The median time on market can help you understand how quickly homes are going under contract, meaning, how quickly a buyer and seller negotiate all of the terms of their sale and officially sign a purchase agreement. Then, typically, the seller or listing agent will change the status of a home from Active to Under Contract or Pending. This is when the purchase process begins, however, typically there are many hoops to jump through before actually closing the sale.
For October 2021, the median time it took to sell a home in California was up 10.0% year over year to only 11 days on market.
– Price Per Square foot
Price per square foot is a useful piece of data, but keep in mind that this data can vary widely depending on many factors. This information is most useful when you are comparing comparable homes in an area, or when you are looking at how a defined real estate market has changed over time.
The median price per square foot in California for October 2021 was $389 which is up 19.3% year over year.
– Sales to List Price Ratio
The Sales Price to List Price ratio gives you a good indication of how hot the market you are analyzing is. If it is over 100%, that means that generally speaking, homes are selling for more than their list price.
In California as a whole for October, the sales to list price ratio was 101.5%, up 1.3% year over year.
Source: California Association of Realtors – Market at a Glance


